
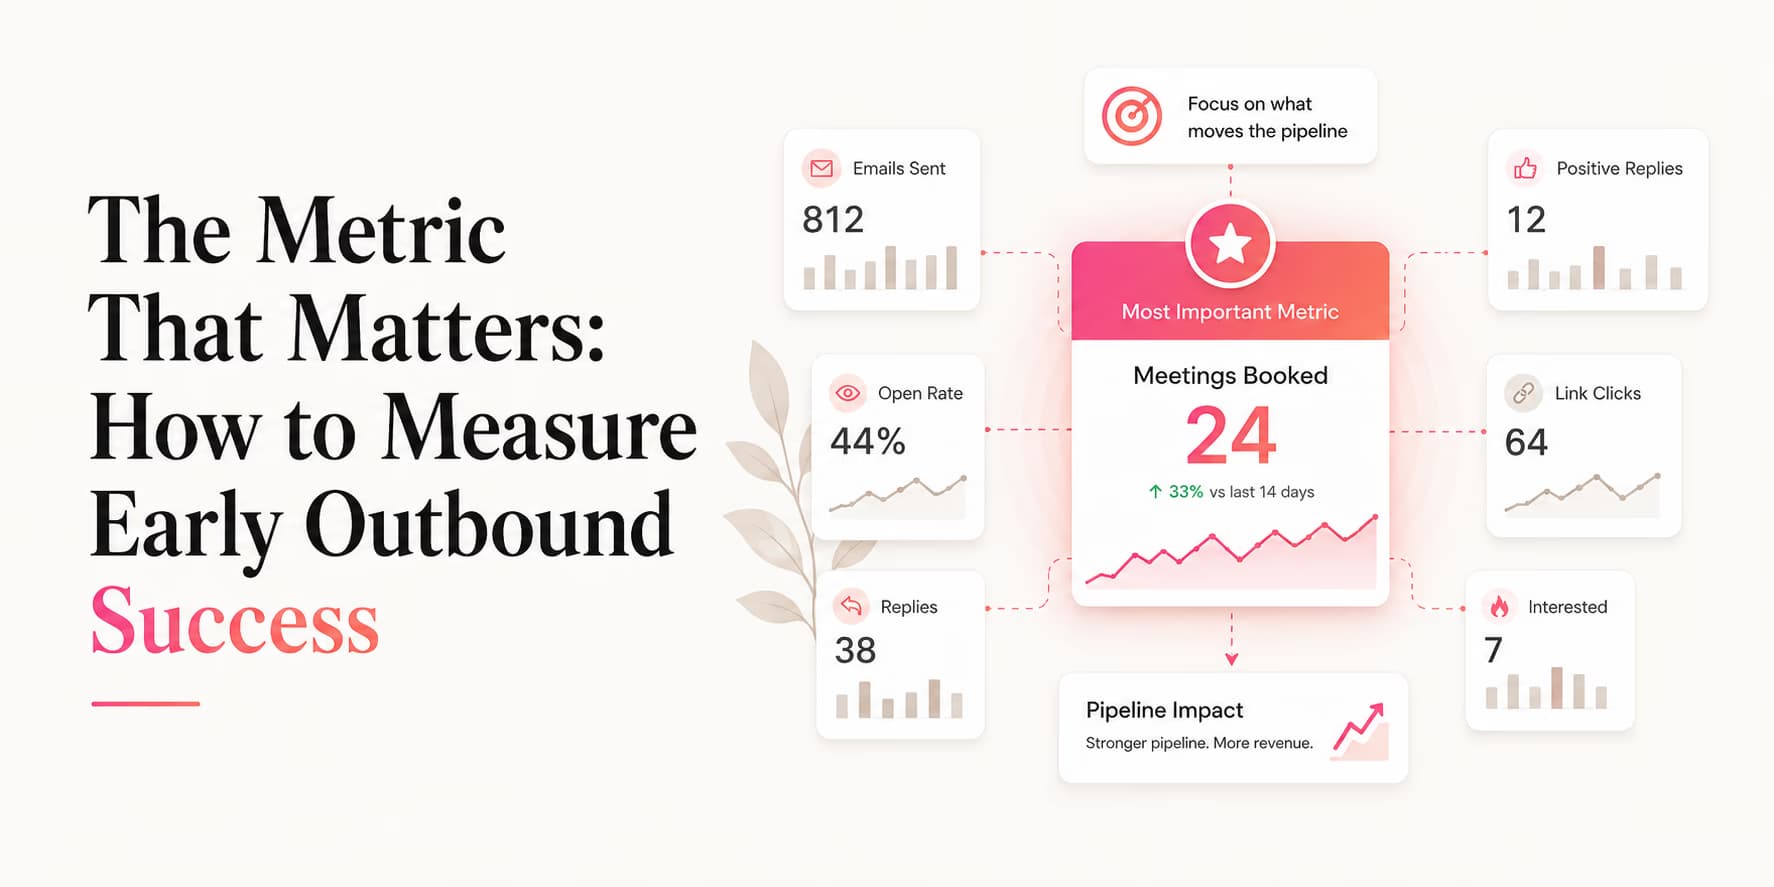
Scaling B2B outbound requires tracking data. Sales operations teams configure dashboards to monitor connection requests accepted, message open rates, link clicks, and reply volumes. Senders look at these charts daily to judge campaign success.
Tracking too many numbers can hide real performance problems. Many teams optimize for vanity metrics, assuming that high connection counts or low click costs mean a healthy sales pipeline.
Vanity metrics do not pay for operations. You can build a list of thousands of connections, but if none of those contacts convert into active sales opportunities, the outbound campaigns are failing.
To build a pipeline that lasts, focus on a few numbers. Track opportunity conversion rates and cost-per-opportunity to verify real demand.
Early outbound dies when the only number on the board is "sends." The useful numbers are smaller, slower, and usually a little embarrassing.
The word "early" matters. A mature outbound team can optimize around revenue, win rate, sales cycle length, and quota capacity. An early team is still answering more basic questions: are we contacting the right people, does the problem land, do prospects trust the offer, and are we learning fast enough to improve the next batch?
That means early outbound success should be measured as a learning system, not just a scoreboard. A campaign that produces fewer demos but reveals a sharper buyer segment may be more valuable than a campaign that produces a few vague calls from poor-fit prospects.
Measure the stage of learning, not just output
Early outbound has three learning stages. First, you test whether the audience is reachable. Second, you test whether the problem creates conversation. Third, you test whether those conversations convert into real opportunities. Teams get into trouble when they judge stage one metrics as if they prove stage three success.
A high connection acceptance rate means your profile and request did not repel the buyer. It does not prove demand. A high reply rate means your opener created enough interest or curiosity to earn a response. It does not prove willingness to buy. A booked demo is stronger, but even a demo only matters if the prospect matches your real customer profile and has a painful problem.
Use this progression:
- Reachability: Are the right people accepting, seeing, or responding to your messages?
- Relevance: Are replies about the problem you solve, or are they polite but shallow?
- Intent: Are conversations turning into demos, audits, pilots, or concrete next steps?
- Fit: Are the interested prospects the kind of customers you actually want?
This keeps you from celebrating noisy volume. The goal is not to create activity. The goal is to prove that a specific buyer segment has a specific problem and will engage with a specific offer.
The key performance indicators for early sales pipelines
An early-stage outbound campaign should focus on pipeline metrics that validate your value proposition.
Track these three numbers:
- Opportunity Conversion Rate (OCR): The percentage of active threads that convert into booked demos.
- Cost Per Opportunity (CPO): Senders monitor the total software and list enrichment costs divided by booked calls.
- Sales Velocity: The average time required to move a prospect from discovery to demo call.
Add two qualitative metrics beside those numbers. First, track reply quality. A reply that says "send info" is weaker than a reply that describes a current workflow problem. Second, track objection themes. Repeated objections tell you whether your issue is targeting, timing, trust, pricing, or offer clarity.
Your dashboard should include the numbers, but your weekly review should include a short written diagnosis. For example: "Founders hiring their first SDR reply to lead-quality messaging, but heads of growth ignore the same angle. Next batch will split founder and growth-lead copy." That one sentence is more useful than staring at aggregate reply rate.
For details on list discovery, see our guide to generating sales leads from LinkedIn.
Opportunity conversion rate: tracking conversations to demos
The Opportunity Conversion Rate measures copywriting relevance. If your reps start multiple conversation threads but fail to book demos, your value pitch is not resonating.
Calculate your OCR using this formula:
OCR = (Booked Demos / Active Conversational Threads) * 100For early campaigns, avoid treating one benchmark as universal. Instead, compare OCR by segment and by message angle. If founder-led SaaS companies convert at a meaningfully higher rate than agencies, your next move is probably narrower targeting, not a generic rewrite. If every segment starts conversations but none book, the issue is more likely your offer or follow-up path.
If OCR is weak, review your prompt variables and copywriting templates, as detailed in our guide to outbound copywriting prompts.
Look at the denominator carefully. "Active conversational threads" should not include every auto-reply, emoji response, or connection acceptance. Count conversations where the prospect engaged with the business topic. Otherwise OCR gets diluted by noise and you make the campaign look worse than it is.
A clean active thread usually has at least one of these signals: the prospect answers your diagnostic question, shares how they handle the workflow today, asks for detail, names an objection, or points you to the right owner. That is the level of engagement worth measuring.
Calculating the real cost per opportunity
Cost Per Opportunity measures campaign financial health. Outbound can be cost-effective, but costs can rise if you purchase expensive databases.
Add your monthly software retainers (including Omentir's Pro plan and list verification tools) and divide by total booked opportunities:
CPO = Total Monthly Outbound Costs / Total Booked DemosKeeping CPO low keeps product validation affordable.
Include time cost if founder time is the scarce resource. A campaign that uses cheap software but requires five hours of founder review per booked call may be more expensive than it looks. Early teams should track both cash cost and human effort so they understand whether the motion can scale.
A practical version of the formula is:
True CPO =
(Software + data + contractor spend + estimated human time cost)
/ qualified opportunities booked
Use qualified opportunities, not just calendar events. A meeting with a student, vendor, or company too small to buy should not make the campaign look efficient. Counting poor-fit calls creates a false sense of progress and burns sales time later.
Metrics rule: value over volume
Avoid increasing sending volume to resolve low reply rates. Increasing volume on unvalidated copy triggers spam blocks. Restrict volume and refine prompt structures to improve conversion metrics first.
Measuring sales velocity and timeline milestones
Sales Velocity tracks how quickly prospects move through your funnel. In early campaigns, look for threads that convert to booked calls in under 5 to 7 days.
If leads linger in your inbox for weeks without booking, verify your follow-up sequence pacing and objection handling responses.
Velocity is useful because it reveals urgency. A high-fit prospect who books quickly probably has an active pain or a timely trigger. A prospect who keeps replying but never commits may be curious, but not urgent. Early teams should separate "friendly conversation" from "pipeline."
Track these milestones:
- First touch to first reply: Measures whether the hook and audience are relevant enough to start a conversation.
- First reply to qualified next step: Measures whether the offer and follow-up can create momentum.
- Next step to actual meeting: Measures scheduling friction and seriousness.
- Meeting to decision: Measures whether the sales conversation is tied to a real buying process.
Do not panic if early velocity is messy. The point is to find where deals stall. If prospects reply quickly but do not book, strengthen qualification and ask sharper diagnostic questions. If prospects book but no-show, improve confirmation and agenda setting. If demos happen but do not progress, the problem may be product fit or offer risk.
How to diagnose metric patterns
Metrics are only useful when they change your next action. Use patterns rather than isolated numbers:
- Low acceptance, low replies: Targeting, profile trust, or connection request relevance may be weak.
- High acceptance, low replies: The audience is reachable, but the message after connection is probably not compelling.
- High replies, low demos: The hook creates interest, but the offer or qualification path is not strong enough.
- Many demos, poor fit: Your copy may be too broad or your qualification rules are letting the wrong buyers through.
- Good demos, no next step: The product, pricing, proof, or buying process needs work.
This diagnosis keeps you from making lazy fixes. More volume is not the answer to every weak metric. Sometimes you need a narrower segment. Sometimes you need a clearer first question. Sometimes you need proof. Sometimes you need to stop targeting a market that is reachable but not urgent.
Enforcing outbox pacing to protect campaign deliverability
Outbound campaigns must respect platform safety limits. Pacing connection requests and messages protects your profile health.
Omentir manages pacing limits automatically, keeping daily connection requests under 20 invites per profile. For pacing metrics, see our guide to pacing LinkedIn campaigns safely.
Safety metrics belong in the same dashboard as sales metrics. Track daily send volume, accepted requests, ignored requests, profile warnings, and negative replies. If your profile health gets worse as volume increases, the sales metrics are not sustainable.
Keep early tests small enough that you can interpret them. A batch of 30 carefully selected prospects can teach more than 500 broad sends because you can read every reply and understand every miss. That learning is what lets you scale later without turning outbound into noise.
SOP: the weekly sales metrics audit checklist
Audit your outbound campaigns weekly using these steps:
- Step 1: Record connection acceptance and conversation reply rates from the dashboard.
- Step 2: Calculate your Opportunity Conversion Rate (OCR) for each campaign segment.
- Step 3: Audit Cost Per Opportunity (CPO) by dividing software fees by booked demos.
- Step 4: Edit copy templates in campaigns that show an OCR below 10%.
Add a written decision log after the numbers:
- What segment performed best? Name the buyer group, not just the campaign.
- What reply theme repeated? Capture the buyer's actual words where possible.
- What objection blocked demos? Separate timing, budget, authority, trust, and product-fit objections.
- What will change next week? Pick one change: target, signal, message, offer, or follow-up.
The one-change rule matters. If you change the segment, message, offer, and follow-up all at once, you will not know what caused the result. Early outbound improves faster when tests are narrow enough to teach you something.
Omentir updates these metrics automatically so you can review campaigns without extra spreadsheet work.
Focus outbound campaigns on revenue fit
Outbound campaigns are only as useful as the metrics you track. By focusing on Opportunity Conversion Rate and CPO, you can optimize your sales pipeline for real validation.
The best early metric is the one that tells you what to do next. Reply rate without a reason is vanity. A list of "why they said no" is an operating document.
Frequently Asked Questions
A connection acceptance proves that a prospect liked your profile title. It does not indicate interest in your product. Senders must track conversation-to-demo conversion rates to verify buying intent.
It depends on price point, segment, and offer maturity. Early teams should watch the direction by segment: if conversations repeatedly fail to turn into demos, the targeting, offer, or follow-up path needs work.
Omentir dashboard monitors active connections, reply volumes, and response intent categories automatically, so you can audit campaign performance.
Divide your monthly software costs (like Omentir's $49/month Pro plan) and list verification fees by the number of qualified demos booked during that period.